Kuflink Statistics Information
A proven track record will always give you confidence.
Kuflink is Authorised and Regulated by the Financial Conduct Authority with a commitment to Transparency. Here is a breakdown of our Lending performance and our Investor Returns Performance.
Cumulative Lending Track Record
Cumulative per year includes all loans completed/writen in that year, month by month, whether open or closed now. Active Loan book includes all live/open loans regardless of when the loan was completed/written.
| Origination Year | 2016 | 2017 | 2018 | 2019 | 2020 | 2021 | 2022 | 2023 | Total / Wt Avg. | OPEN Loans |
|---|---|---|---|---|---|---|---|---|---|---|
| Loan Count | 10 | 50 | 54 | 91 | 86 | 123 | 160 | 114 | 688 | 157 |
| Total Gross Loan Amount | £1.2 m | £13.8 m | £21.2 m | £45 m | £37.8 m | £86.2 m | £76.6 m | £77.2 m | £359.1 m | £123.2 m |
| Total Net Loan Amount | £1.2 m | £13.8 m | £20.1 m | £45 m | £33.7 m | £58.7 m | £56.8 m | £57.9 m | £287.5 m | £93.5 m |
| Average Gross LTV | 53 % | 58 % | 61 % | 70 % | 58 % | 62 % | 66 % | 73 % | 66 % | 71 % |
| Average Net LTV | 51 % | 56 % | 57 % | 65 % | 51 % | 54 % | 59 % | 57 % | 57 % | 57 % |
| Average Gross Loan | £0.12 m | £0.28 m | £0.39 m | £0.49 m | £0.46 m | £0.7 m | £0.48 m | £0.69 m | £0.52 m | £0.8 m |
| Average Property Value | £0.59m | £0.71m | £0.73m | £0.90m | £0.79m | £0.89m | £0.57m | £0.69m | £0.75m | £0.9m |
| Average Monthly Interest Rate | 1.9 % | 1.5 % | 1.1 % | 1.1 % | 1.1 % | 1.0 % | 1.0 % | 1.1 % | 1.1 % | 1.0 % |
| Average Contractual Term (Mo.) | 8 | 10 | 10 | 11 | 12 | 12 | 11 | 11 | 11 | 13 |
| Average Actual Term (Mo) (2) | 9 | 12 | 12 | 13 | 14 | 14 | 12 | 13 | 12 | 14 |
| Average Additional Months | 26 | 2 | 4 | 3 | 3 | 1 | 0 | 2 | 7 | 2 |
| % of Loans Repaid Late (vs Gross Loan) | 45.4 % | 34.8% | 23.7 % | 18.9 % | 26.8 % | 12.1 % | 19.6 % | 24.2 % | 9.2 % | 19.66 % |
Active Loan Book
Cumulative per year includes all loans completed/writen in that year, month by month, whether open or closed now. Active Loan book includes all live/open loans regardless of when the loan was completed/written.
| Origination Year | OPEN Loans |
|---|---|
| Origination Year OPEN Loans Loan Count | 157 |
| Total Gross Loan Amount | £123.2 m |
| Total Net Loan Amount | £93.5 m |
| Average Gross LTV | 71 % |
| Average Net LTV | 57 % |
| Average Gross Loan | £0.8 m |
| Average Property Value | £0.9m |
| Average Monthly Interest Rate | 1.0 % |
| Average Contractual Term (Mo.) | 13 |
| Average Actual Term (Mo) (2) | 14 |
| Average Additional Months | 2 |
| % of Loans Repaid Late (vs Gross Loan) | 19.66 % |
Annual Investment returns
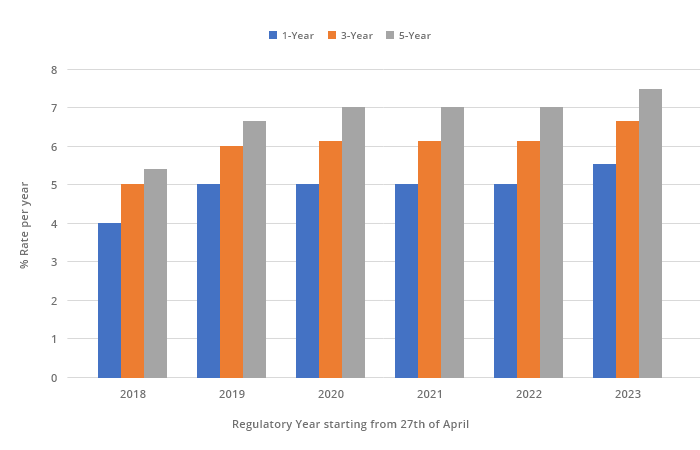
Here’s a snapshot of Kuflink Select Invest and Pool performance since launch. These are what Investment returns look like in different product types – Select invest, Pool (Auto and IF-ISA Invest)
Select Invest % Interest Rate per year
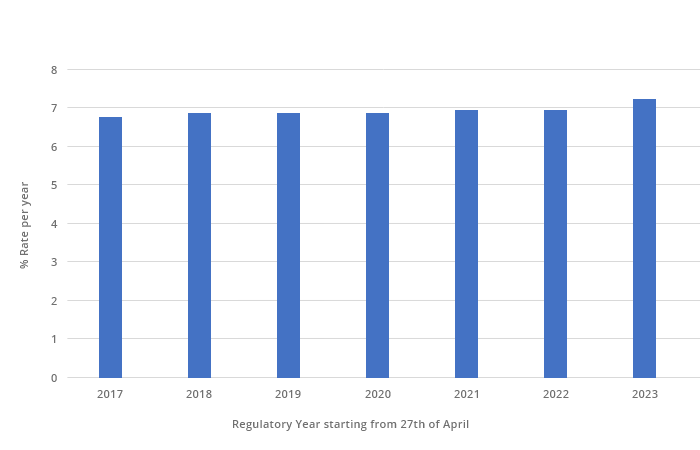
Pool Invest % Interest Rate per year
Default Rates by Risk Category
As with all P2P investment platforms your capital is at risk.
We are sure you will have seen all our risk warnings (such as capital is at risk & Kuflink is not protected by the FSCS) that our compliance team make sure we put everywhere. We also categorise our deals with a risk rating, below is a quick chart to show the default rate % over the years allocated to each category.
FCA's Default Definition
A loan is in default when the borrower is past the contractual payment due date by more than 180 days (approx. 6 calendar months).
The rate (as a percentage) is the total of the gross loan amounts in default divided by the total gross loan amount over the same period times by 100. Rates below taken on April 27th of each respective year.
-
20180%
-
20190%
-
20200%
-
20213.09%%
-
20220%
-
20236.83%
-
2024*1.7%
-
20180%
-
20190.44%
-
20201.12%
-
20210%
-
20220%
-
202311.48%
-
2020*2.2%
-
20180%
-
20190%
-
20200%
-
20210%
-
20220%
-
20230%
-
2024*0%
-
20180%
-
20190.24%
-
20200.81%
-
20211.26%
-
20220%
-
20238.77%
-
2024*1.8%
*For the predictive default rate, the definition used was the simple average of the percentages over the 6 years 2018-2023.
Kuflink's Default Definition
A loan is in default when it is 1 calendar month past a missed payment, with this payment still outstanding. This may be a monthly servicing payment or the full repayment at the end of the term.
The rate (as a percentage) is the total of the gross loan amounts in default divided by the total gross loan amount over the same period times by 100. Rates below taken on April 27th of each respective year.
-
20180
-
20190
-
202017.31
-
20215.09
-
20220.27
-
202315.66
-
2024*6.00
-
20180
-
20196.61
-
202023.58
-
20217.77
-
202218.88
-
202316.93
-
2024*12.00
-
20180
-
20290
-
20200
-
20210
-
20220
-
20230
-
2024*0
-
20180
-
20195.65
-
202021.84
-
20216.67
-
20228.79
-
202316.18
-
2024*10.00
*For the predictive default rate, the definition used was the simple average of the percentages over the 6 years 2018-2023.
In the event a loan goes into default as a result of late payment of interest or capital, Kuflink will immediately start taking action to recover the funds or remedy the loan on investor’s behalf. You will continue being paid interest until the loan is repaid.
To date, our investors have not had any losses as a result of defaults.
Forbearance between 1st May 2021 to 31st July 2023
- During this period 18 loans have been provided with forbearance
- 17 of these loans have repaid in full and one is currently open (Updated 1st September 2023)
Forbearance between 27th April 2020 to 27th April 2021.
- 30 Loans that were on the platform during this period were provided with forbearance
- 29 of these were due to covid and 1 was due to long term financial difficulties
- 26 of these loans have then been repaid in full following forbearance (Updated 17th November 2021)
Disclaimer: The above Information contains tables and other statistical analyses that Kuflink has prepared. We have used numerous assumptions in preparing this statistical Information, which may or may not be reflected in the material. The statistical information should not be construed as legal, tax, investment, financial, or accounting advice. The Information is provided as of the dates shown and is subject to updating and revision, and may change materially without notice. Subject to applicable regulations, no person is under any obligation to update or revise the Information. The Information may contain various forward-looking statements, which are statements that are not historical facts and that reflect Kuflink’s beliefs and expectations with respect to future events and financial and operational performance. These forward-looking statements involve known and unknown risks, uncertainties, assumptions, estimates and other factors, which may be beyond the control of Kuflink and which may cause actual results or performance to differ materially from those expressed or implied from such forward-looking statements. Nothing contained within the Information is or should be relied upon as a warranty, promise, or representation, express or implied, as to the future performance of any loans. Any historical Information contained in this statistical information is not indicative of future performance.
Kuflink's Environmental, Social and Governance page
Please click here to see Kuflink Group's monthly Financial Statistics.